A recent email exchange with a Mediterranean user drew my attention to a specific aspect of electronic charting : zoom limitation of a chart. ENC vector charts (¹) are classified in 6 categories depending scale : smallest scales less than 1:1.500.000 for global views to largest scale up to 1:4.000 for harbours and anchorages. (²).

Marine charts international classification
In most cases, ENC S-57 (¹) official charts the most detailed have a scale about 1:4000, thus 1 cm on the chart (screen view) represent 40 meters on the ground. With paper chart, the only way to get more details is… to use a a magnifying glass, that provides, as we know, in no case more accuracy. But it is quite otherwise for electronics charts.
The ENC S-57 designed by world hydrographic services are purchased under license by many organizations to achieve private vector charts (Private ENC (¹)) mainly sold for recreational boating. Navionics charts, Garmin, C-Map and others editors (³) design in this way their own charts for use with their software and navigation devices that support. And this is where it gets complicated.
My partner pointed out to me that the Navionics, used with iNavX, was limited to scale 1:4000, while a small handheld charting GPS was perfectly able to enlarge a chart much more , providing a greater accuracy for landing. Indeed, some applications and some devices allow so-called’ "overscale" for vector chart, that is to say an upper-scale. For raster charts, the term "overzoom" we would use, or over-enlarging. This is the effect obtained with an iPhone or iPad with a double-tap with three fingers when activated the zoom option in the Accessibility settings.
Overscale
Transas chart, below with iSailor, whose source is not specified, allows an important overscale. Can be artificially enlarge objects up to a scale 1:380 thus 1 cm represents 3.80 meters !
In iSailor, we can increase overscale from 1:10.000 to 1:385, thus 1 cm represents less than 4.00 meters !
In SEAiq with CM93 charting, overscale a roughly equivalent is obtained :

The nominal scale 1:20.000 is increased up to 1:440, thus 1 cm for 4.40 meters
With BlueChart by Garmin, a more great overscale is allowed :

Better with BlueChart, can enlarge up to 1 cm for 3.00 meters, a score !
With C-Map charting in Plan2Nav by Jeppesen, we enlarge scale – only – to 1 cm for 12.00 meters, thus a scale 1:1.200.
Hence, only Navionics charts prohibits overscale, either in iNavX or in their own applications (Navionics Marine and Navionics Boating).
The accuracy in question
To begin with, it is reassuring that the calculation of distances remains correct, regardless of the zoom level. Proportions are constrained, but only as long as we did not reach the maximum overscale level .

Distances between identical points are generally kept at different overscale level.
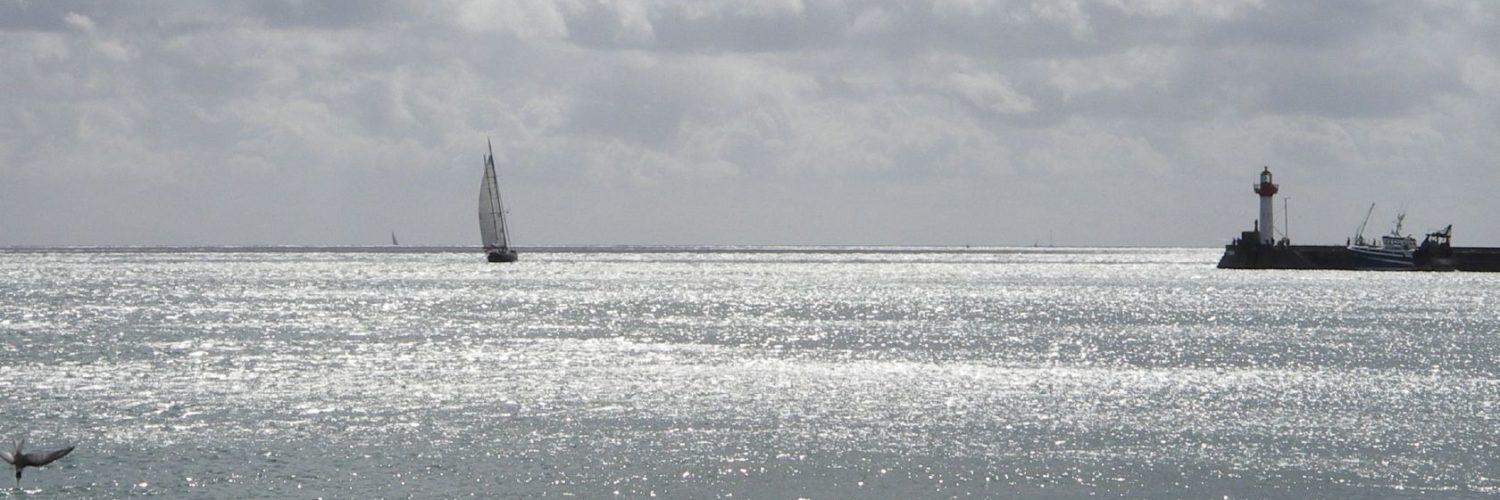
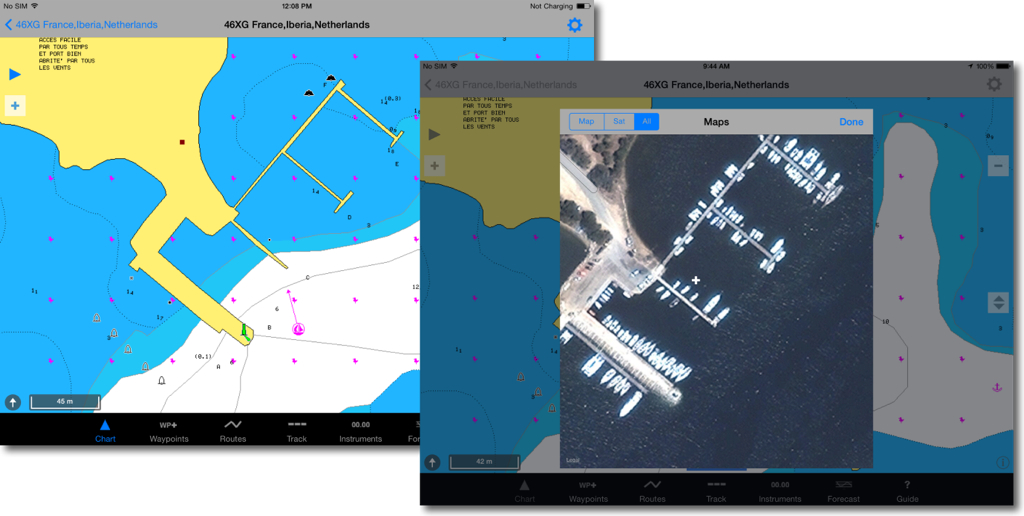
Maximum zoom levels cause distortion of cartographic representation. The quay where stand the lighthouse in our example has not the same shape according to the charts, and it is interesting to note that only the Navionics chart shows the exact shape of the jetty, confirmed by satellite view. With other editors drawing remains rough and approximate :

The design of the jetty is exactly the reality at standard maximum scale 1:4.000
On the other hand, if the measured distances and the ruler clearly confirm a scale 1/4000ᵉ, we can blame the blue label displays the wrong scale 1:3K (1:3000).[*Update]
Be that as it may,, must be extremely careful with overscale. If chart shows a pierhead, as here, about 6.00 meters wide with maximum overscale, it is not at all sure that this is right. Landing such a jetty on the sole basis of this chart reading seems to me imprudent. The chart shows a false impression of a perfectly straight and steep pierhead, while the reality is quite different. One would be tempted run closer during a night arrival with poor visibility. Navionics, on the opposite without overscale, requires to deviate from it cautiously in doubt.
It should therefore not be misled by the false sense of accuracy that gives overscale, no offense to my interlocutor that I salute and thank here to have inspired me this post. A chart will never provide more detail than its designers have provided for a given scale. Overscale is only a magnifying glass providing comfortable reading for tired eyes, surely, but nothing more.
—
[*Update 15 May 2014] Next iNavX release will allow scale up to 1:2000 for Navionics charts and "Tiled Charts" ”.
New scale in iNavX at maximum zoom
—
(¹) See Glossary for definition.
(²) beware of confusion : scale 1/1.500.000ᵉ is smaller than 1/4.000ᵉ which shows more détails. Greater is the scale, smaller and detailed is the geographic area.
(³) View article The stakeholders of electronic charting.
—
Relative article :
ENCs, Routing and sailing shaves stone
—