El Niño continues to develop in tropical Pacific regions. Forecasters expect the phenomenon to continue until spring, with 75 down to 85 % likely to become an intense event. A stronger El Niño – the definition of which will follow – means that it is more likely that we will see its effects reflected in winter temperatures and rain and snow patterns around the world.
Source & screenshots : NOAA – Emily Becker freely translated.
The warning signs
First of all, The numbers. The main measure of El Niño growth is the ocean surface temperature in the region Niño-3.4, an area located in the east-central equatorial Pacific. This region was chosen because it was found to have the strongest relationship with tropical atmospheric changes. Specifically,, This is the’Temperature anomaly, that is, the difference between this temperature and the long-term average (long-term = 1991-2020). In September, the Niño-3.4 index was 1,6 °C, according to the ERSSTv5, Our most reliable sea surface temperature dataset.

History on 2 years of sea surface temperatures in the Niño-3.4 region of the tropical Pacific for all events evolving towards El Niño since 1950 (Grey lines) and the current event (purple line). NOAA Climate.gov image based on a graph by Emily Becker and monthly CPC Niño-3.4 data using ERSSTv5.
El Niño is a coupled system, which means that the ocean and tropical atmosphere act in concert to keep the El Niño event going on and amplifying. The average pattern of air circulation over the tropical Pacific, called Walker's circulation, brings ascending air, clouds and storms over the very warm waters of the far western Pacific, Winds from west to east aloft, air descending over the eastern Pacific and east-west surface winds, called trade winds. In the case of El Niño, warmer-than-average surface waters in the east-central Pacific lead to increased rising air in this region, which weakens Walker's circulation (¹).
The atmospheric part of El Niño clearly shows these signs. All the indications of a weakening of the Walker circulation are present : more rain and clouds in the east-central Pacific, a slowdown in the trade winds and high winds, and drier conditions in Indonesia and the far western Pacific. Overall, the ocean surface and atmospheric conditions tell us that El Niño will continue for at least the next few months.

Sea surface temperature difference in September 2023 compared to the average of 1985-1993 (details taken from Coral Reef Watch). Most oceans are warmer than average.
Likely intensification
Certain that El Niño will continue throughout the winter, The question is how strong it will be. Definitions of intensity, that typically use the Niño-3.4 index, are not official, because an El Niño with a Niño-3.4 index peaks at 1,5 °C will not have significantly different effects than an El Niño with a Niño-3.4 index peaking at 1,4 °C. However, As mentioned above, stronger El Niño, the more likely it is that it will affect global temperature and rain and snow patterns in the way predicted. Indeed, a greater change in sea surface temperature leads to a greater change in the Walker circulation, which increases the likelihood that El Niño will affect the jet stream and cause a cascade of global impacts.
The unofficial definition of a strong El Niño is a three-month average Niño-3.4 index of at least 1,5 °C. El Niño is a seasonal phenomenon, and this three-month average Niño-3.4 index (called the Ocean Niño Index (or ONI) is important to ensure that ocean and atmospheric changes persist long enough to affect the planet's weather and climate. An ONI peak of 2,0 °C or higher is considered "historically strong" or "very strong". We have only known of four of them in the historical archives since then 1950.
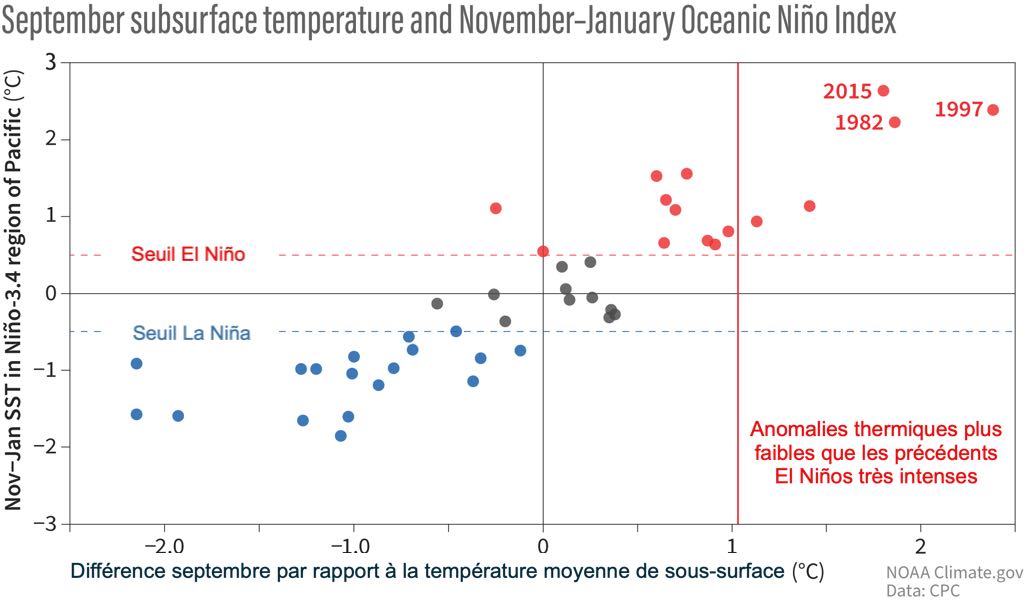
What about a peak at 2,0 °C or higher ? Forecasters give about 3 Chances on 10 for the November-January period. Climate models have a fairly wide range of potential outcomes, if they were concentrated above 2,0 °C, we would probably be able to give more reliable probabilities. Moreover, although there is still a fair amount of heat beneath the Pacific surface – This warmer water provides power to the surface – it is not quite at the level of what we have seen in previous historically strong El Niños such as 1982-83, 1997-98, or 2015-16.

Each point in this scatter plot shows the subsurface temperature anomaly (Difference from the long-term average) in the Central Tropical Pacific every September (horizontal axis) from 1979 compared to ENSO ocean conditions for the following November-January (vertical axis). The red vertical line shows the subsurface temperature anomaly in September 2023. The amount of warmer-than-average subsurface water in September is closely related to ENSO ocean conditions later in the year. Previous strong El Niño events, 1982-83, 1997-98, and 2015-16, had more hot water below the surface than 2023.
Aggravating factors
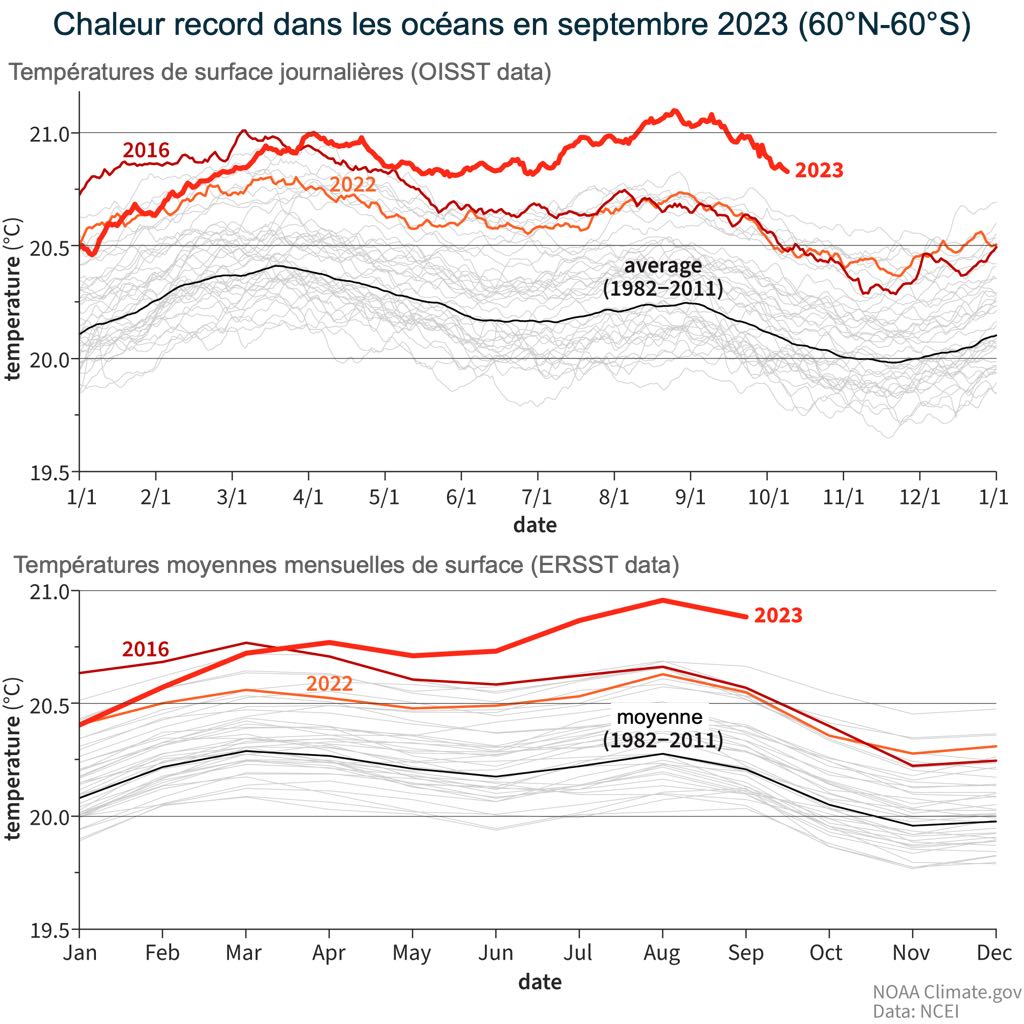
Ocean temperatures are still well above average, With astonishing records in recent months.

Non-polar sea surface temperature (60 °N – 60 °S) world-averaged 1982 down to 2023. Thick black lines represent the average 1982-2011 on the calendar year 2022 (Orange Line), 2023 (thick red line) and 2016 (the year of record heat before 2023 Thin red line) are highlighted. Thin grey lines represent all other years. Both graphs show that the last few months have been marked by record warming of the global ocean
The two graphs above show two different sets of data, one with daily values and the other with monthly averages. Matching two different sets of data helps confirm that this is a true characteristic, therefore reliable.
The extreme heat of the planet's oceans – perceptible on these graphs – means that this El Niño is taking place in a different world than previous El Niños. For example, the hurricane season in the North Atlantic is often calmer during El Niño, but this year, The season has already been very active, with 18 Named Storms, because the North Atlantic Ocean, hot, provided plenty of fuel.
–––
(¹) Read the article El Niño is back
–––


Thanks for sharing the article. Very interesting. To see what the impact is on the trade winds